Short answer: you measure audience diversity by who your spend actually reaches. Pull spend by age, and by age and gender, for each month. Work out each group’s share of that month’s total and stack the bars. You are looking for a group whose share jumps in one month, and a group that drops out of the mix. Ads Manager shows dollars in a table but does not draw the share-over-time view, so you export it and chart it yourself. It takes about three minutes, and it is the audience counterpart to measuring creative diversity by placement.
When people ask whether they are reaching the right audience, they usually check the targeting they set. The more useful check is the output: who did Meta actually spend on? Broad delivery means the system decides, and what it decides can shift from one month to the next without any report telling you.
Page Contents
What does audience diversity mean in a Meta ad account?
It means how your spend is distributed across the people you reach, by age, gender and other cuts, instead of resting on one group. Diversity here is not a goal in itself. A subscription app may well have one core audience. The point is to know the split, to notice when it moves, and to decide on purpose whether the move is good for you.
Why does audience mix matter for scaling?
Because growth can come from one kind of customer until it cannot. If the budget is leaning on one group, you have learned about that group and nothing else, and the day it saturates or its cost rises you have nowhere else to go. A mix that is moving without you choosing it is also a sign that something in the creative or the delivery changed. That is worth chasing.
How do you check spend by age over time?
- In Ads Manager, add a breakdown by age and a monthly time breakdown, covering the last four to six months.
- Export the table.
- In a spreadsheet, divide each age group’s spend by that month’s total spend.
- Chart it as stacked bars, one bar per month.
Ads Manager shows dollars. Share is what shows composition.
What can an age mix tell you? A real example
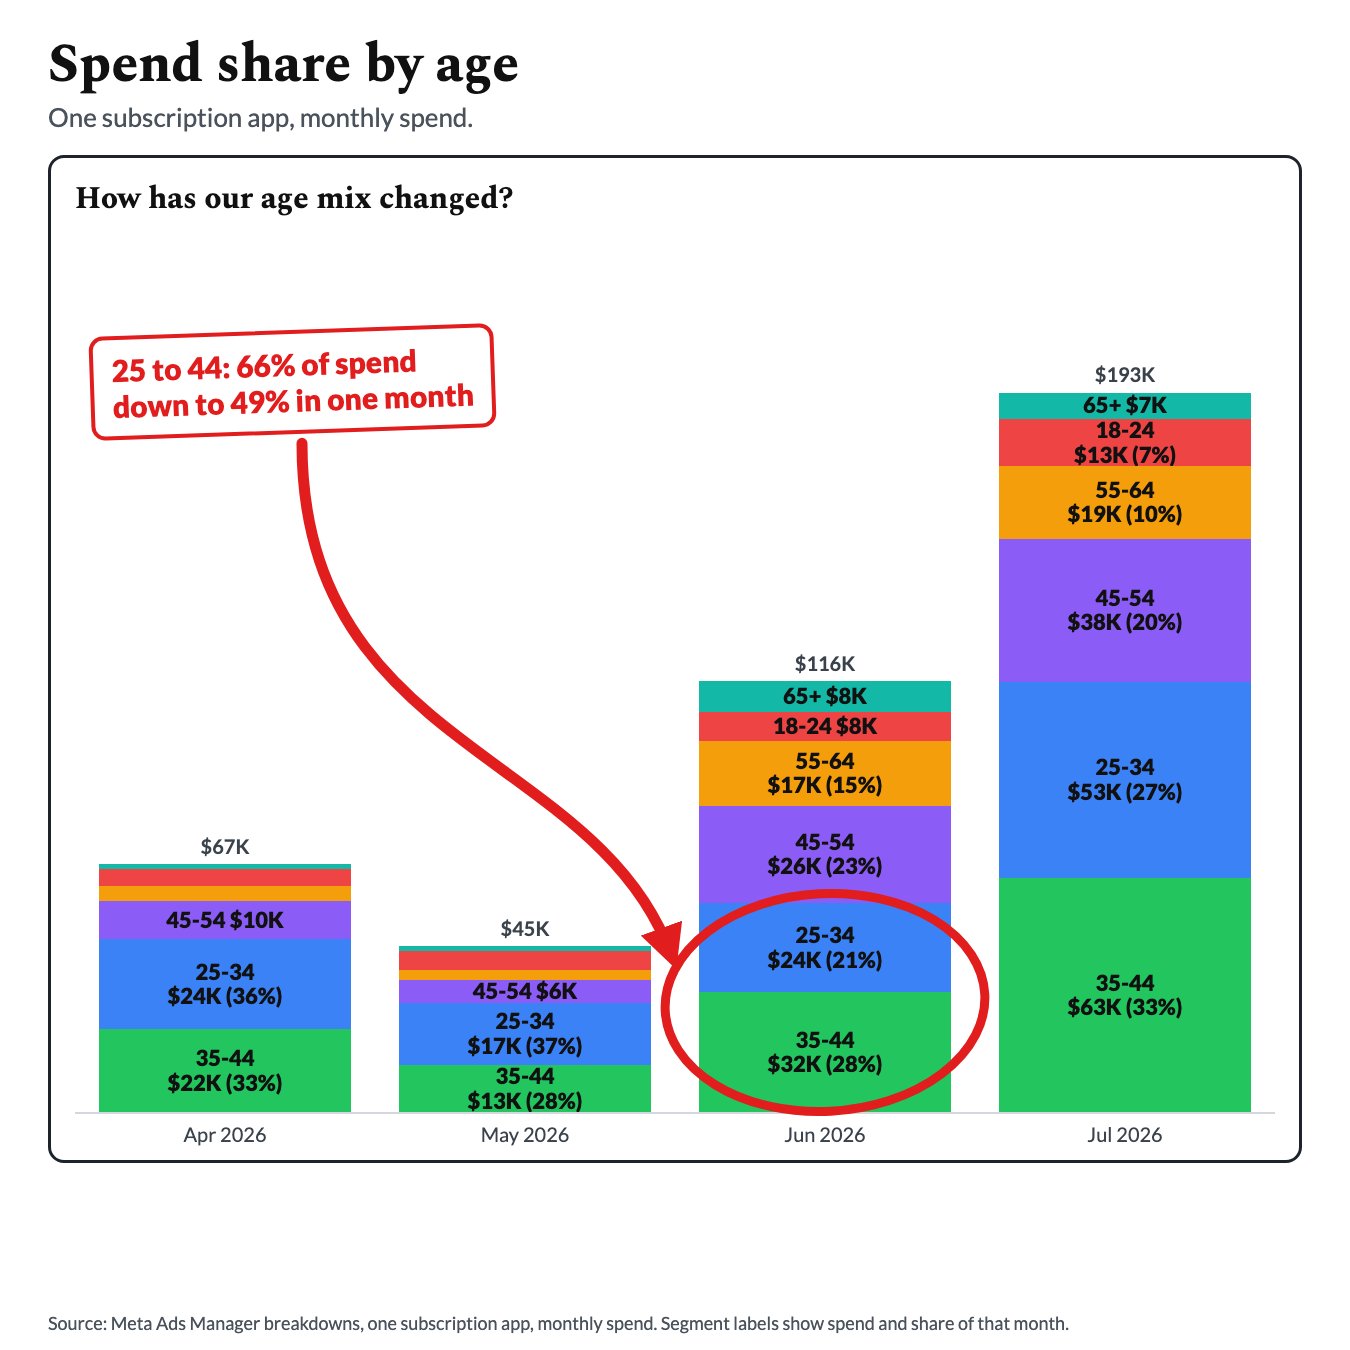
Here is one subscription app across four months:
| Month 1 | Month 2 | Month 3 | Month 4 | |
|---|---|---|---|---|
| 25 to 44 | 70% | 66% | 49% | 60% |
| 55 and over | 8% | 10% | 22% | 14% |
| 18 to 24 | 7% | 11% | 7% | 7% |
| Total spend | $67K | $45K | $116K | $193K |
In month three, spend went from $45K to $116K. The 25 to 44 group fell from 66% of spend to 49%, and the 55-plus groups more than doubled, from 10% to 22%. The next month, 55-plus slipped back to 14%.
No ROAS report flags that. ROAS is an outcome averaged across everyone, so a shift in who is getting the budget can happen underneath a healthy number. I do not know from this chart alone why the mix moved. When a share jumps and falls back within a month, something in the creative or the delivery changed, and that is what I chase.
Should you look at gender as well as age?
Yes, because they can move separately. In the same app, the month spend rose from $116K to $193K, the gender split moved too:
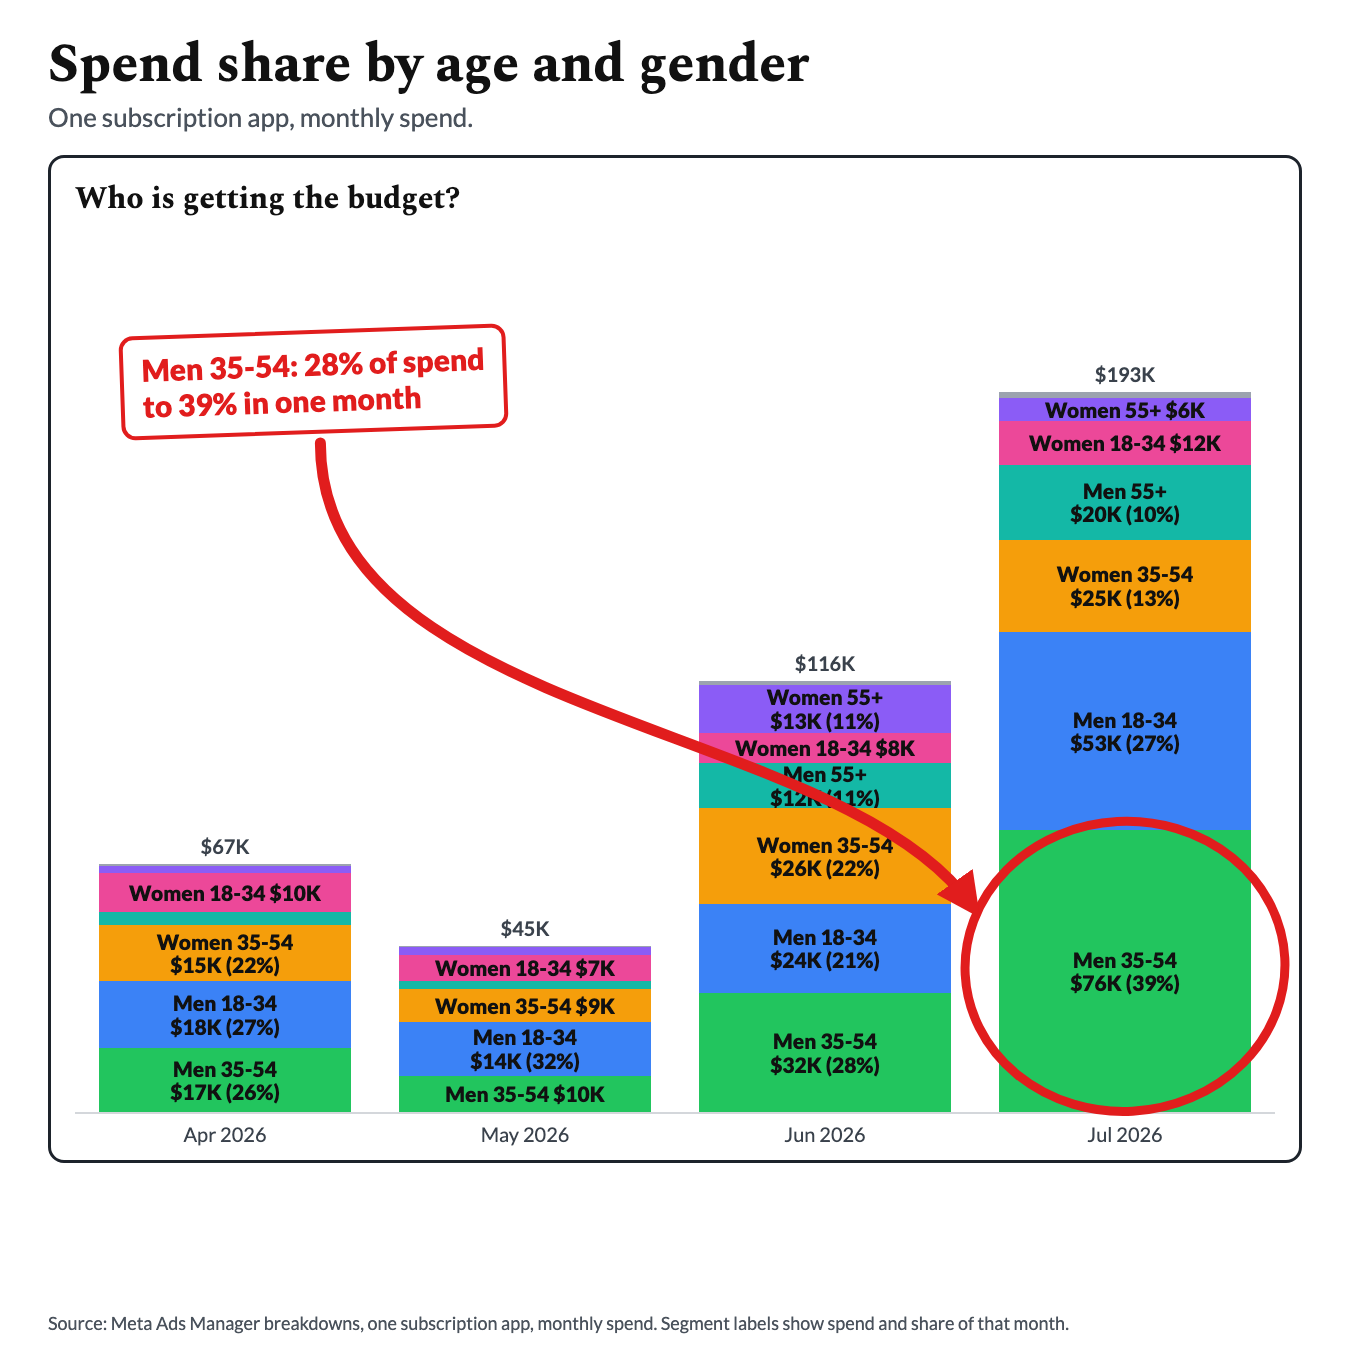
- Men aged 35 to 54 went from 28% of spend to 39%.
- Women aged 35 to 54 went from 22% to 13%.
- Across the whole account, men went from 59% of spend to 77%.
Reading age and gender together shows which group inside the movement took the budget.
Is share enough, or do you need cost per result too?
Share tells you where the money went. It does not tell you whether the audience getting it is the one that pays. In one month of this app, men cost $99 per trial and women cost $156, against an account average of $115. A cheaper audience pulls more budget, and that is one reason a mix drifts. But a cheap trial is not a paying user. Check the groups by cost per paying user and LTV, not only cost per trial. The reasoning is in why Meta spends more budget on one ad.
What should you do when one group takes over?
- Check cost per result, then paying users and LTV, for the group that gained share.
- Look at which creative is feeding it. A mix usually moves because of what the ads say and show.
- Make creative for the groups that dropped out, if they are customers you want. Different creative reaches different people.
- Test new creative in its own ad set, away from proven winners. See how to structure creative tests for Meta ads.
- Do not force the audience with narrow targeting by default. The evidence on broad versus interest targeting is in broad vs interest targeting on Meta.
How is audience diversity different from creative diversity?
Audience diversity tells you who your ads are reaching. Creative diversity, measured through placement, tells you where they are showing. They fail separately, so check both. The placement check is in how to measure creative diversity in your Meta ad account.
Frequently asked questions
What is audience diversity in Meta ads? It is how your spend is distributed across the people you reach, by age, gender and other cuts. Measuring it tells you who is getting the budget and whether that is changing.
How do you measure audience diversity? Export spend by age, or by age and gender, for each month. Divide each group by that month’s total and stack the bars. Look for a group whose share jumps in a single month and a group that drops out of the mix.
Can Ads Manager show spend share by age over time? Ads Manager can break spend down by age and gender and by month, as a table of dollars. It does not draw the share-over-time view, so you export the table and chart it in a spreadsheet.
Why would my audience mix change without me changing targeting? With broad delivery, Meta decides who sees your ads, and the creative strongly influences who responds. A change in the creative or in how delivery is distributed can move the mix. This chart shows that it happened; it does not tell you why.
Does a lopsided audience mix mean something is wrong? Not necessarily. Many apps have one core audience. It is a flag to confirm the group getting the budget is the one that pays, and to notice when the split moves.
How often should you check it? Monthly is enough to see the mix. Check again whenever spend steps up sharply, because the mix can shift in a single month.