Short answer: you measure creative diversity by where the spend actually goes. Pull spend by placement and by month, work out each placement’s share of that month’s total, and stack the bars. If one placement, or one ad, holds most of the budget month after month, the account is leaning on one thing. That is one of the quieter reasons accounts stall when they try to scale. Ads Manager gives you the numbers as a table of dollars but does not draw the share-over-time view, so you export it and chart it yourself. It takes about three minutes.
Most advice on creative diversity is about making more ads. That is the input. The more useful check is the output: how widely did Meta spread your budget? Two accounts with the same number of ads can look completely different once you see where the money went.
Page Contents
What does creative diversity mean in a Meta ad account?
It means how widely your spend is spread, across ads, formats, messages and placements, instead of resting on one of them. We track five things in our internal dashboards:
- Spend freshness. What share of spend goes to ads launched this month versus three months ago. If everything scaling is old, the pipeline is dead and nobody has noticed yet.
- Format mix. Video against static, and how that split moves.
- Message concentration. If one angle is doing most of the work, that is a bet with a clock on it.
- Velocity. How many new ads reach the account. Without a pipeline, concentration creeps back.
- Placement distribution. Whether spend is spread sensibly across Reels, Stories and Feed.
Placement is the easiest to start with, because Meta already gives you the breakdown.
Why does spend concentration matter?
Because it is invisible in the numbers most people watch. We have come close to the brink on three accounts. One was spending $10K a day with a single ad doing all the heavy lifting. The dashboard looked beautiful. Then that ad slipped, and when one ad carries everything, slipped turns into on fire. The three cases looked different on the surface and had the same cause: concentration. Every time, the warning signs were there for weeks, and we were looking at the wrong numbers.
I would not call concentration the only reason an account stalls. It is one that almost nobody reports, which is why it is worth checking first.
How do you check spend by placement over time?
- In Ads Manager, add a breakdown by placement and a monthly time breakdown, covering the last four to six months.
- Export the table.
- In a spreadsheet, divide each placement’s spend by that month’s total spend.
- Chart it as stacked bars, one bar per month.
Steps 3 and 4 are what Ads Manager does not do for you. It shows dollars. Share is what shows composition.
What does a healthy placement mix look like?
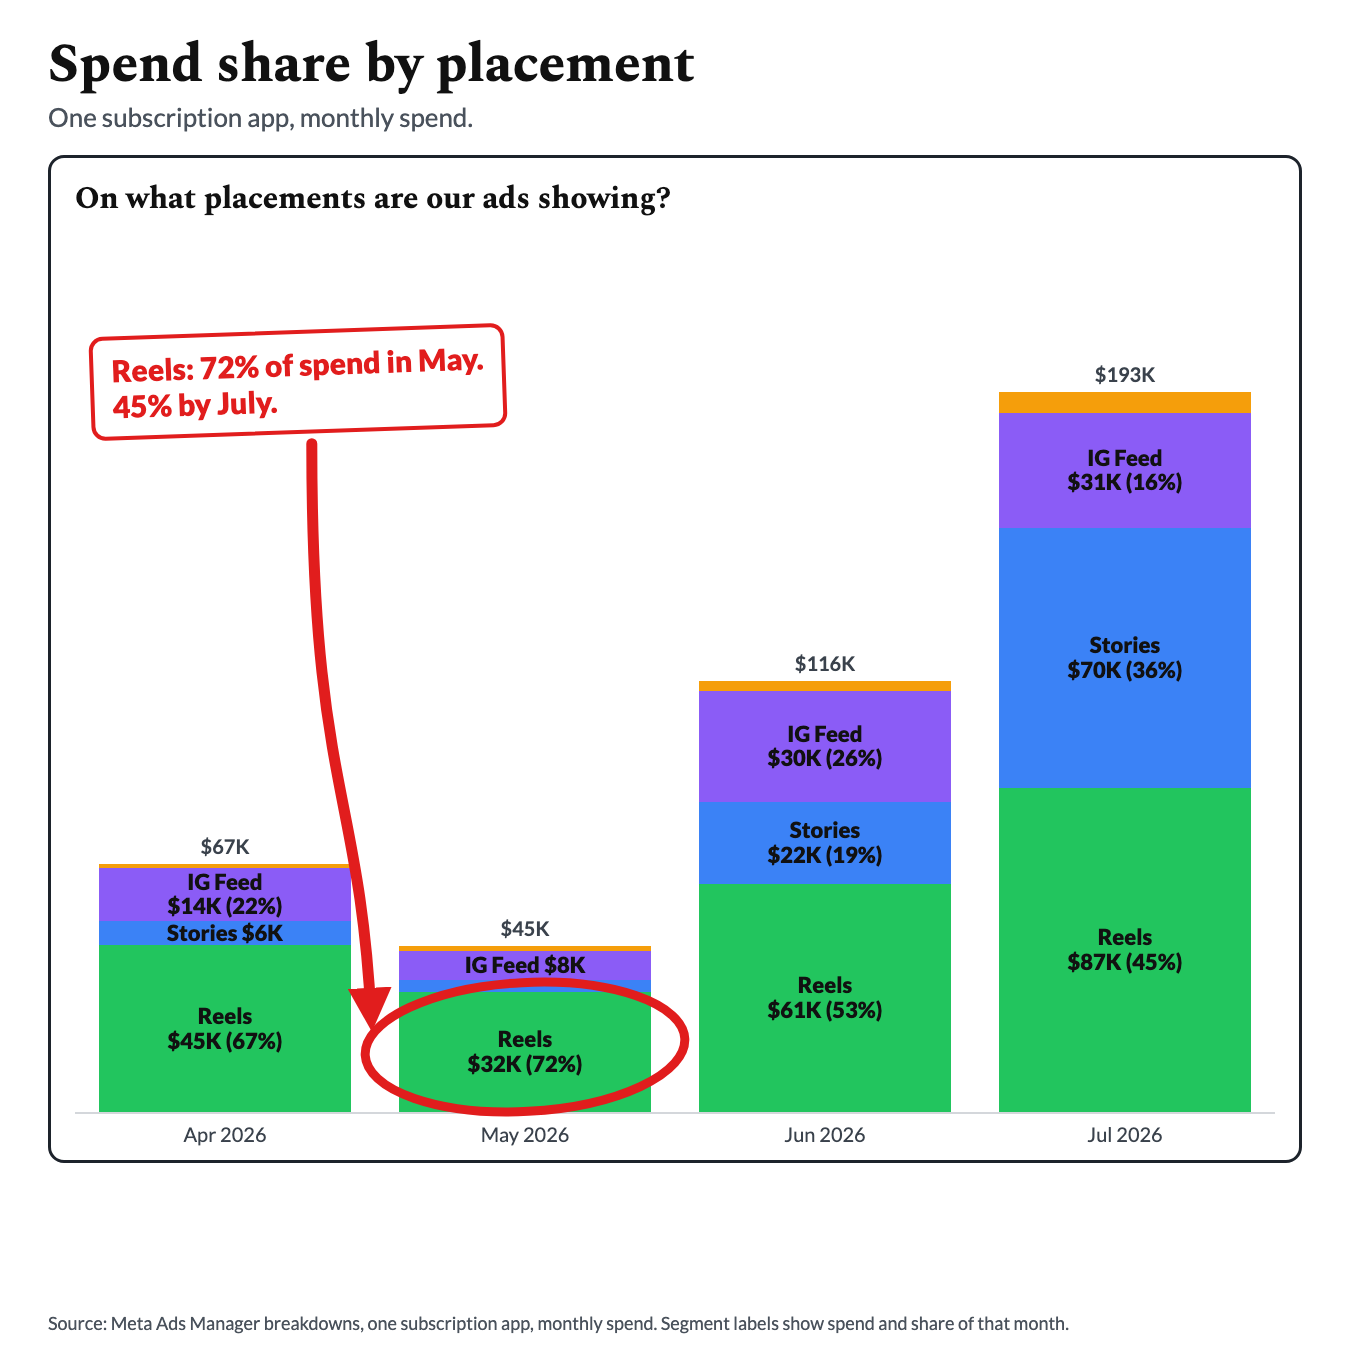
There is no universal split, and I will not give you a number to hit. What matters is the direction and how long a pattern lasts. Here is a real example from one subscription app:
| Month 1 | Month 2 | Month 3 | Month 4 | |
|---|---|---|---|---|
| Reels | 67% | 72% | 53% | 45% |
| Stories | 9% | 7% | 19% | 36% |
| IG Feed | 22% | 17% | 26% | 16% |
| Total spend | $67K | $45K | $116K | $193K |
Reels carried 72% of spend in month two. By month four it carried 45%, Stories had grown from 7% to 36%, and total spend had grown about four times from month two. That is the direction I want to see: more places carrying weight as spend rises.
I am not claiming the spread caused the growth. I am saying a concentrated account would have looked different in this chart, and you would have seen it before the numbers got worse.
Is share enough, or do you need cost per result too?
Share tells you where the money went. It does not tell you whether it went somewhere good. In month three of the same app, Reels took 53% of spend at $123 per trial and Stories took 19% at $79, against an account average of $115. The biggest share was not the cheapest trial.
And a trial is not a paying user. If a placement wins on cost per trial and loses on paying users and LTV, Meta is optimising an event that does not pay you. We cover that check in why Meta spends more budget on one ad.
Why doesn’t ROAS show this?
ROAS is an outcome averaged across everything. Composition is invisible in it. An account can post a healthy ROAS while one placement carries it, and the number will not change until the day that placement slips.
Concentration also happens partly by design. Meta’s delivery system estimates the expected outcome of every ad and gives the next impression to the best one, which is a Bayesian bandit. Shamanth Rao wrote the explanation for Mobile Dev Memo: Bayesian Bandits: behind the scenes of Facebook’s spend allocation decisioning. It means the system will happily concentrate spend, and it is your job to notice when concentration stops serving you. You do not need to wait for a learning phase to read this chart; see why “how do I exit the learning phase” is the wrong question.
What should you do if one placement dominates?
- Check cost per result and downstream quality for that placement. Cost per trial, then cost per paying user and LTV.
- Do not force equal budgets to make it look balanced. That deletes the signal about what scales. See why Meta spends more budget on one ad.
- Test new creative in its own ad set, away from proven winners, so the incumbent does not starve it. The structure is in how to structure creative tests for Meta ads.
- Make creative that can run in the underweight placements. A winning concept often needs a different cut for Stories or Feed.
- Give it time to show up in the chart. The mix moves over weeks, not days.
How is creative diversity different from audience diversity?
Placement tells you where your ads are showing. Age and gender tell you who they are reaching. They are separate checks and they fail separately. The second one is covered in how to measure audience diversity on Meta.
Frequently asked questions
What is creative diversity in Meta ads? It is how widely your spend and creative are spread across ads, formats, messages and placements, instead of resting on one of them. A diverse account has several things carrying weight. A concentrated one depends on one ad, one format or one placement.
How do you measure creative diversity? Start with spend share by placement, month by month. Export spend by placement and by month, divide each placement by that month’s total, and stack the bars. Then add format mix, message concentration and spend freshness as you can.
What is a good placement split on Meta? There is no universal split. Watch the direction and how long a pattern lasts, and check cost per result by placement, because the biggest share is not always the cheapest trial. In the example above, the mix moved from Reels at 72% to Reels at 45% while spend grew about four times.
Can Ads Manager show spend share by placement over time? Ads Manager can break spend down by placement and by month, as a table of dollars. It does not draw the share-over-time view, so you export the table and chart it in a spreadsheet.
How often should you check it? Monthly is enough to see the mix. Check again whenever spend steps up sharply or scaling stalls.
Does a lopsided placement mix mean something is wrong? Not necessarily. Meta concentrates spend by design. It is a flag to look at cost per result and downstream quality, and to confirm you are not leaning on one placement for months.