
Originally published October 2019. The model is platform-independent; its retention and cost per install figures are illustrative assumptions, not benchmarks.
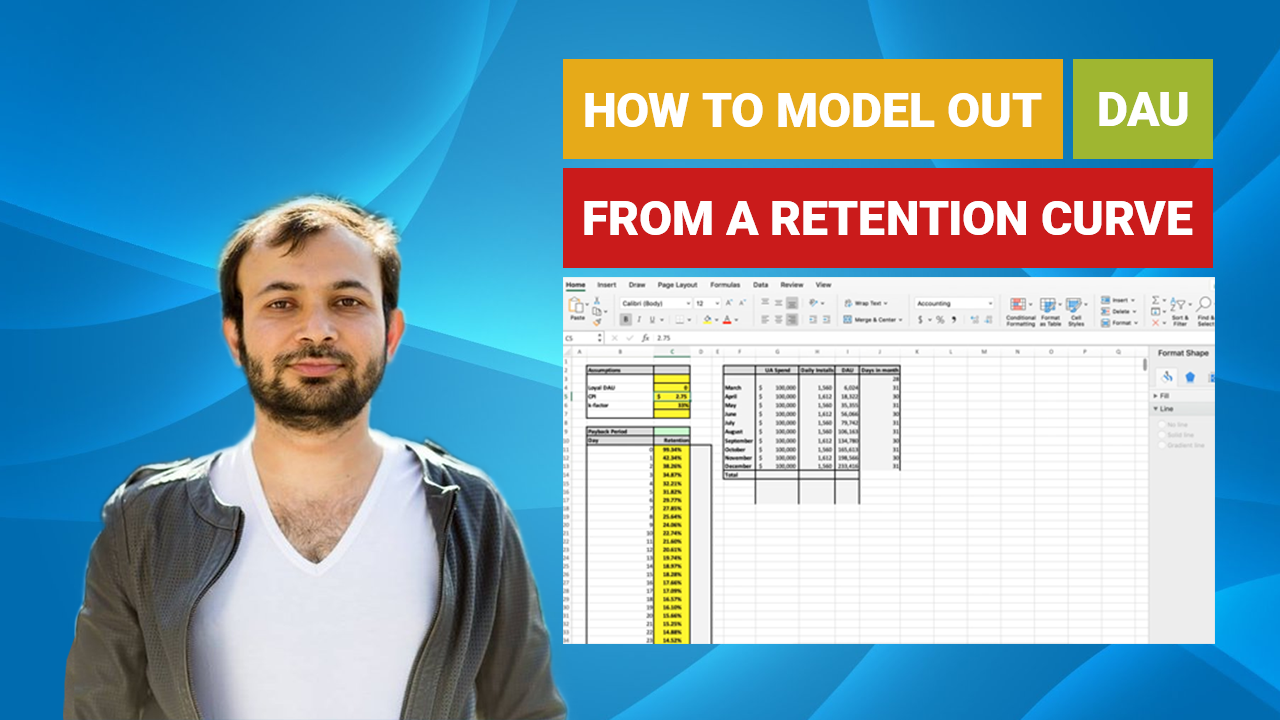
Short answer: to estimate daily active users (DAU), turn your monthly spend into daily installs, apply your retention curve to each day’s installs, and add up the users still active from every earlier day. That sum is your DAU on any given date. Watch the walkthrough on YouTube.
Page Contents
What inputs does the model need?
The video starts from assumptions and says plainly that a model is not reality, but it helps you make decisions:
- A retention curve. The illustrative game has 42% of installers active on day 1.
- A cost per install (CPI). The example uses $2.75.
- A monthly spend. The example uses $100K.
- An organic multiplier. An assumed 33% extra organic installs per paid install. Correlation alone does not establish that paid acquisition caused them; see how many organic users each paid user drives.
- A starting DAU, for users you already have. A brand new app starts at zero.
How does the calculation work?
- Daily installs. Monthly spend divided by CPI gives paid installs for the month. Multiply by one plus the organic multiplier to include organics, then divide by the number of days. For a 31-day month: $100,000 × 1.33 / $2.75 / 31 ≈ 1,560 installs a day.
- Apply retention to each day’s installs. The day 0 cohort is almost fully active (about 99%), day 1 about 42%, and so on down the curve.
- Add the cohorts. For each cohort, multiply installs by retention at its age on that date, including day 0. Add those active-user estimates. In the video that gives roughly 2,200 DAU on the second day and 2,800 on the third.
- Average if you are planning. Over a long projection you can average the DAU for the month, recognizing that averages are not always accurate.
What does the model leave out?
By the video’s own caveats: it is a starting point, not a precise forecast. The starting DAU is simply added with no attrition, though a real base also churns. It also uses one retention curve, a flat daily budget and flat days of the week; you can make each more granular, or work with an analyst on a more sophisticated version. Its use is scenarios: what happens to DAU if CPI rises, spend changes or retention improves.
Frequently asked questions
How do you estimate DAU from retention? Multiply each cohort’s installs by its day-specific retention and sum the active-user estimates. Inactive on one day does not necessarily mean permanently churned.
Are the numbers in the video benchmarks? No. They are illustrative assumptions for a casual game; use your own data.
How is this related to LTV? For revenue forecasting, see how to calculate LTV without a lifetime of data.