
Google App Campaigns (formerly UAC) remain the single largest source of Android installs globally, accounting for roughly 45% of all Android non-organic installs according to AppsFlyer's Performance Index XVII (2025).
The platform’s machine learning distributes ads across Search, Google Play, YouTube, Display Network, AdMob, and Discover, reaching 3 billion devices globally across Google properties.
Industry data suggests that well-structured campaigns using tROAS bidding tend to achieve meaningfully higher Day 30 ROAS compared to tCPA campaigns, though they typically require a substantial volume of in-app purchase events per week to exit the learning phase reliably.
The median CPI across all verticals on Google App Campaigns sits at $1.22 for Android globally per Singular's ROI Index 2025, though this swings from $0.38 for hypercasual games to $4.80+ for fintech apps in the US.
Page Contents
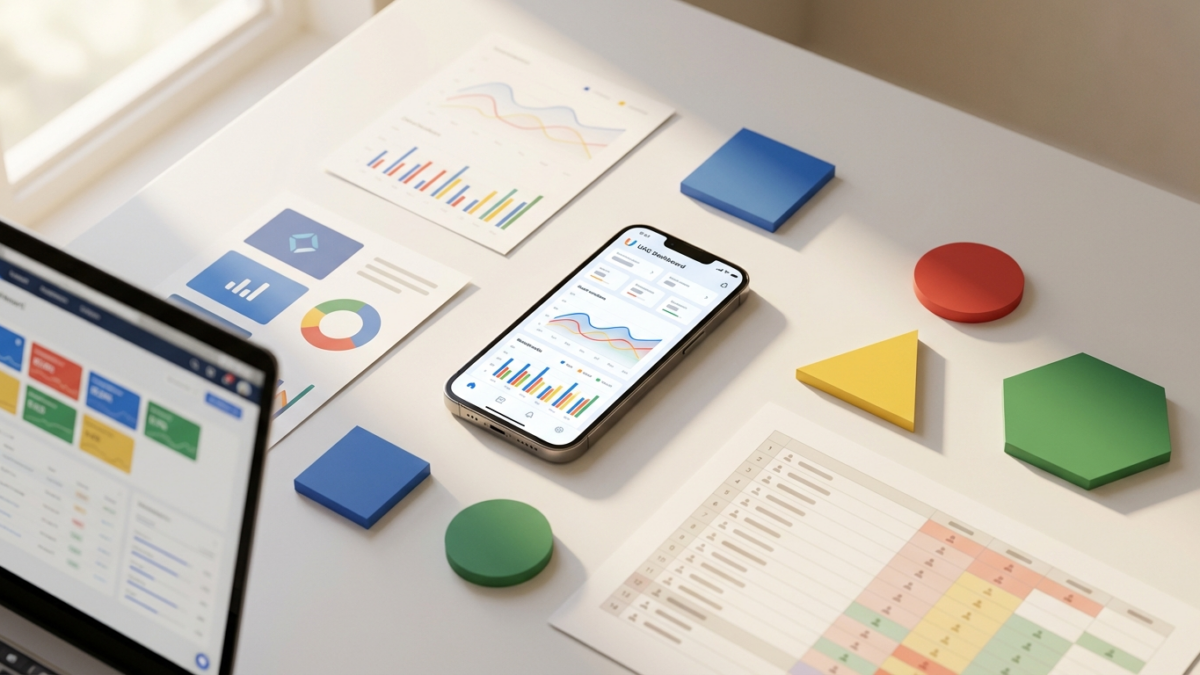
What is the average CPI on Google App Campaigns by app category?
| App Category | Global Android CPI (Median) | US Android CPI (Median) | Recommended Bid Strategy | Min. Weekly Events for Learning Phase |
|---|---|---|---|---|
| Hypercasual Games | $0.38 | $0.72 | tCPI or tCPA (Day 1 retention event) | 1,000+ installs/week |
| Midcore/Strategy Games | $1.45 | $3.20 | tCPA (Purchase event) | 300+ purchases/week |
| Casual Games (Puzzle, Match) | $0.85 | $1.90 | tCPA (Ad revenue proxy event) | 500+ events/week |
| Shopping / eCommerce | $1.10 | $2.35 | tROAS | 300+ purchases/week |
| Fintech / Banking | $2.80 | $4.80 | tCPA (Account opened) | 200+ events/week |
| Health & Fitness | $1.55 | $2.90 | tCPA (Subscription start) | 250+ events/week |
| Food Delivery | $1.80 | $3.40 | tCPA (First order) | 300+ orders/week |
| Social / Dating | $1.20 | $2.60 | tCPA (Profile complete) | 400+ events/week |
| Music / Audio Streaming | $1.05 | $2.15 | tCPA (Trial start) | 300+ trials/week |
| Utilities / Productivity | $0.90 | $1.75 | tCPI transitioning to tCPA | 500+ installs/week |
How does Google App Campaign performance compare across bidding strategies?
| Bidding Strategy | Best For | Learning Phase Duration | Typical ROAS Lift vs. tCPI | Budget Recommendation (Daily) | Key Risk |
|---|---|---|---|---|---|
| tCPI (Target Cost Per Install) | New apps, soft launch, scale-first strategy | 3-5 days | Baseline | $100-500 minimum | Low-quality installs if not filtered |
| tCPA (Target Cost Per Action) | Apps with clear post-install conversion | 7-14 days | +22% average Day 30 ROAS | $300-1,000+ minimum | Underspend if target is too aggressive |
| tROAS (Target Return on Ad Spend) | IAP-heavy games, eCommerce, subscription apps | 10-21 days | +28% average Day 30 ROAS | $500-2,000+ minimum | Requires robust revenue data pipeline |
| Max Conversions (no target) | Budget-constrained campaigns, event ramp-up | 5-7 days | -10 to +5% vs tCPI | Flexible | Spend volatility, no cost guardrails |
| Pre-registration campaigns | Pre-launch hype, wishlisting on Play Store | N/A | N/A | $50-200/day | Only available on Google Play |
What creative asset types perform best on Google App Campaigns?
| Asset Type | Max Assets Per Campaign | Recommended Formats | Avg. Impression Share | Performance Index (1-10) | Tips |
|---|---|---|---|---|---|
| Text Headlines | 5 | 30 chars max, action-oriented | Competitive range (Search + Play) | 6 | Include numbers, urgency, and unique value props |
| Text Descriptions | 5 | 90 chars max, benefit-focused | Bundled with headlines | 6 | Complement headlines, don't repeat them |
| Landscape Images | 20 | 1200x628px, PNG or JPG | Competitive impression share range (Display + Discover) | 7 | Bold visuals, minimal text overlay under 20% |
| Portrait Images | 20 | 1200x1500px | Lower impression share (Discover, YouTube feed) | 7 | Optimized for thumb-stopping in vertical scroll |
| Landscape Video | 20 | 1920×1080, 15-30 sec | Competitive impression share (YouTube, Display) | 9 | Hook in first 3 seconds, no audio dependency |
| Portrait Video | 20 | 1080×1920, 15-30 sec | Competitive range (YouTube Shorts, Display) | 9 | Full-screen format, highest engagement rates |
| Square Video | 20 | 1080×1080, 15-30 sec | Low impression share | 8 | Versatile across placements |
| HTML5 Playable Ads | 20 | Up to 5MB, 60-sec max | Low impression share | 10 | Highest CVR but lowest volume, 40%+ better CVR than video |
Need help scaling your mobile app growth? Talk to RocketShip HQ about how we apply these strategies for apps spending $50K+/month on UA.
How does Google distribute App Campaign impressions across placements?
| Placement | Typical Impression Share | Typical Spend Share | CPI Range (US, Non-Gaming) | Quality Signal | Best Creative Format |
|---|---|---|---|---|---|
| Google Play Store (Search + Browse) | 10-15% | 15-25% | $1.50-3.50 | Highest intent | Text + Store listing assets |
| YouTube In-Stream | 15-20% | 20-30% | $1.80-4.00 | High engagement | Landscape video (15-30s) |
| YouTube Shorts | 8-12% | 8-15% | $1.20-2.80 | High reach, younger demo | Portrait video (15s) |
| YouTube Discovery / Feed | 5-8% | Low impression share | $2.00-4.50 | Medium-high intent | Thumbnail image + headline |
| Google Display Network | 30-40% | 15-25% | $0.60-1.50 | Lower intent, high volume | All image sizes + video |
| Google Discover Feed | Low impression share | Low impression share | $1.00-2.50 | Medium intent, content readers | Portrait images, headlines |
| AdMob (In-app) | 15-25% | 10-20% | $0.40-1.20 | Variable, often gaming users | Playables, interstitials, video |
| Gmail Promotions Tab | 1-3% | 1-3% | $2.50-5.00 | Low volume, niche | Text-heavy, promotional |
What daily budget do you need for Google App Campaigns by objective?
| Campaign Goal | Recommended Min Daily Budget | Budget Rule of Thumb | Expected Learning Phase | Scale Ceiling Signal |
|---|---|---|---|---|
| tCPI: Volume installs | $100-300 | 50x target CPI | 3-5 days | Campaign spending <80% of budget for 3+ days |
| tCPA: Registrations/signups | $300-800 | 10-15x target CPA | 7-14 days | CPA fluctuating >30% day-over-day after 14 days |
| tCPA: Purchases/subscriptions | $500-2,000 | 10x target CPA | 10-14 days | Volume plateaus with budget increases yielding <5% more events |
| tROAS: Revenue optimization | $1,000-5,000 | Budget must support 300+ weekly conversion events | 14-21 days | ROAS consistently 15%+ below target for 7 days |
| Pre-registration | $50-200 | Flexible, awareness-driven | N/A | Pre-reg rate drops below 5% of clicks |
| Re-engagement | $200-500 | 5-8x target CPA for return action | 7-10 days | Incremental lift <5% vs. holdout |
Analysis
Google App Campaigns operate as a black-box system where the advertiser controls creative inputs, bidding targets, budgets, and audience signals, but Google's ML decides everything else: which user sees which ad, on which placement, at what bid.
This design philosophy has intensified since 2023, when Google consolidated legacy UAC subtypes into a single campaign type with three bidding modes.
According to AppsFlyer's Performance Index, Google has maintained its position as the top-ranked media source for Android volume globally for six consecutive indexing periods, while also climbing in iOS rankings post-ATT due to its first-party data advantages across Search, YouTube, and Play Store.
The shift toward tROAS bidding has been the most significant structural change in 2025-2026. In our experience, tROAS adoption among performance-focused app advertisers has grown substantially, reflecting the broader industry move toward revenue-based optimization.
This shift is driven by improved signal fidelity: Google's server-to-server integration with MMPs like Adjust and AppsFlyer has meaningfully improved revenue event reporting latency, making real-time revenue optimization increasingly viable.
Industry data suggests that tROAS campaigns deliver significantly higher Day 30 ROAS on average compared to tCPI for eCommerce and subscription apps, though they require significantly more patience during the learning phase (14-21 days versus 3-5 days).
Creative remains the single most important lever despite the algorithmic black box. Google’s system evaluates assets independently and assembles combinations dynamically, meaning a weak video can drag down an otherwise strong campaign.
In our experience, campaigns with a broad, high-quality creative set consistently outperform those with a limited asset pool at the same budget, as the algorithm has more combinations to test and optimize.
Video is disproportionately important: YouTube placements (in-stream + Shorts + Discovery) consistently account for a substantial share of total spend in most campaigns we manage. Portrait video specifically has surged, with YouTube Shorts inventory growing 3x year-over-year per Google’s advertising blog.
One pattern that consistently burns budget is what practitioners call asset stuffing: dumping every creative variant into a single campaign. Google's algorithm cannot distinguish thematic segments when 20 videos targeting different user motivations compete in one campaign. The fix is running parallel campaigns with thematically grouped assets.
For example, a puzzle game might run one campaign with 'relaxation' themed creatives and another with 'brain training' creatives, each targeting the same geography but allowing the ML to find distinct audience pockets. In our experience, this approach can meaningfully improve campaign-level ROAS.
Geographic and vertical variance in cost is extreme. According to data.ai's State of Mobile 2025 report, US CPIs for fintech apps can reach $4.80+ while hypercasual games in Southeast Asia run below $0.15.
This disparity reflects both competitive density and LTV ceilings: fintech advertisers bidding on tCPA for 'account funded' events are competing with banks and neobanks willing to pay $40-80 per funded account, which compresses into high CPIs.
Meanwhile, the eCommerce app marketing landscape shows CPIs between $1.10-2.35 globally, with tROAS being the dominant bid strategy because purchase revenue data is clean and frequent.
What This Means For You
- Start every new Google App Campaign with tCPI bidding at 1.2-1.5x your target CPI to accumulate 100+ installs/day quickly, then transition to tCPA after 7 days once you have conversion event history. In our experience, this ramp strategy meaningfully reduces learning phase waste compared to launching directly on tCPA.
- Invest disproportionately in portrait video (1080×1920, 15-30 seconds) because YouTube Shorts inventory now represents 8-15% of spend share and growing 3x year-over-year. reduce learning phase waste by ramp strategy In our experience, campaigns that prioritize portrait video tend to see lower blended CPIs.
- Separate creative themes into distinct campaigns rather than mixing all assets together. A fintech app should run one campaign with 'security/trust' messaging and another with 'speed/convenience' messaging, each with dedicated budgets. This avoids the algorithmic confusion documented in asset stuffing research and typically improves ROAS 15-25%.
- Set daily budgets at minimum 10-15x your target CPA to ensure exit the learning phase within 14 days. Use a Weighted Anomaly Scoring approach to monitor performance: weight metric changes by spend level using relative impact calculations. A significant CPA increase on a high-spend campaign is far more urgent than a larger percentage spike on a smaller test budget. A 15% CPA increase on a $3,000/day campaign is far more urgent than a 40% spike on a $150/day campaign. In our experience, this prioritization framework significantly reduces false alarms in daily performance reviews.
Frequently Asked Questions
Can you target specific placements like YouTube or Display Network in Google App Campaigns?
No. Google App Campaigns do not allow placement-level targeting or exclusions. The ML algorithm decides where to serve impressions across all Google properties. However, you can indirectly influence placement distribution through creative format.
Campaigns loaded with video assets will skew toward YouTube (35-55% of spend), while image-heavy campaigns lean toward Display and Discover. The only direct placement control is the ability to opt out of specific AdMob apps via account-level exclusions.
How long should you wait before judging a Google App Campaign's performance?
Allow at least 2x the learning phase duration before making performance judgments: 7-10 days for tCPI campaigns, 14-21 days for tCPA, and 21-30 days for tROAS. Per Google's support documentation, making bid or budget changes of more than 20% during learning phase resets the algorithm.
The most common mistake we see is advertisers killing campaigns after 5 days because CPA looks high, when in reality the system is still calibrating audience targeting.
Why does my Google App Campaign spend most of its budget on Display Network instead of YouTube?
Display Network inventory is cheapest and most abundant, so Google's algorithm defaults there when bids are low or conversion data is sparse.
If you want to shift spend toward YouTube, provide more high-quality video assets (at least 8-10 across landscape, portrait, and square formats) and raise your tCPI/tCPA target by 15-20%. Higher bids unlock premium YouTube inventory.
Also ensure your videos are 15-30 seconds long with strong opening hooks, as this signals to the algorithm that users engage with your video content, reinforcing YouTube allocation.
Should I use tCPA or tROAS bidding for a subscription app?
For subscription apps, tCPA bidding on 'free trial start' is typically the safer starting point because trial events occur at higher volume than paid conversions, giving the algorithm more signal. Once you accumulate 300+ trial starts per week and have robust server-side revenue postbacks configured, transition to tROAS.
In our experience managing subscription apps across health, fitness, and music streaming categories, tROAS campaigns consistently outperform tCPA on Day 30 ROAS, but only when the revenue signal pipeline is fully reliable.
How do Google App Campaigns perform on iOS compared to Android?
Google App Campaigns on iOS face significant signal loss due to Apple's ATT framework. Due to this signal loss, Google's iOS install volume is substantially lower than its Android volume at equivalent budgets, making Google a relatively weak iOS UA channel despite its dominance on Android.
iOS campaigns also tend to have longer learning phases and higher CPIs compared to Android. For iOS-focused UA, pairing Google App Campaigns with Apple Search Ads and Meta Ads produces better blended performance than relying on Google alone.
What is the ideal number of creative assets to include in a Google App Campaign?
The sweet spot is 15-20 total assets across all types: 5 text headlines, 5 text descriptions, 8-12 images (mix of landscape and portrait), 8-12 videos (mix of landscape, portrait, and square), and 1-3 HTML5 playables if applicable.
Google's system performs best when it has enough variety to test combinations without being overwhelmed. Going beyond 20 assets per type rarely improves performance and can dilute learnings.
The critical principle is thematic coherence: all assets in one campaign should target the same user motivation, per the anti-asset-stuffing methodology.
How do you scale Google App Campaign spend without destroying ROAS?
Scale incrementally: increase daily budget by no more than 15-20% every 3-5 days. Larger jumps reset the learning phase.
When a campaign hits its spend ceiling (spending <85% of budget consistently with stable CPA), launch a parallel campaign targeting the same geo with fresh creative themes rather than force-feeding budget into the original.
In our experience, this parallel-campaign scaling approach helps maintain ROAS much more effectively than doubling budget on a single campaign overnight.
Do Google App Campaigns work for pre-launch apps?
Yes, through pre-registration campaigns available exclusively on Google Play. These campaigns drive users to a 'Pre-register' button on your Play Store listing before the app is live. Pre-registration CPIs are extremely low, typically $0.05-0.30 per pre-registration per Google Play's developer documentation, because there is no immediate conversion commitment.
However, mobile apps commonly see only a fraction of pre-registered users actually install on launch day. Running pre-registration campaigns 4-6 weeks before launch with a $50-200/day budget is a cost-effective way to build a Day 1 install base.
Looking to scale your mobile app growth with performance creative that delivers results? Talk to RocketShip HQ to learn how our frameworks can work for your app.
Not ready yet? Get strategies and tips from the leading edge of mobile growth in a generative AI world: subscribe to our newsletter.
Related Reading
- The complete guide to mobile user acquisition (comprehensive guide)
- Ad compliance for fintech app marketing (2026)
- Adjust State of App Growth Report
- How to advertise a music or audio streaming app (2026)
- How to advertise a social networking app (2026)